TweetMore than 12,000 secondary school children have failed to get a school preference of their choice, figures have revealed.
Recently published data from the Department of Education shows the number of applications being made to secondary schools for pupils to begin their studies in 2013/14 has falled by almost 10,000.
The three main figures the Department want us to see are below and generally show the application process is working well. They show increasing number of families getting places at their preferred schools.
- 85.3% of families received an offer of a place at their first preference school – an increase of 0.7% compared to March 2011 and continuing the recent rising trend.
- 95.9% of families received an offer of a place at 1 of their top 3 preferred schools – an increase of 0.3% compared to March 2011 and continuing the recent rising trend.
- 97.6% of families received an offer of a place at one of their preferred schools – an increase of 0.3% compared to March 2011 and continuing the recent rising trend.
But beyond these figures what does the data say? Where in the country has the most amount of applications, where are you most likely to get your first choice of school?
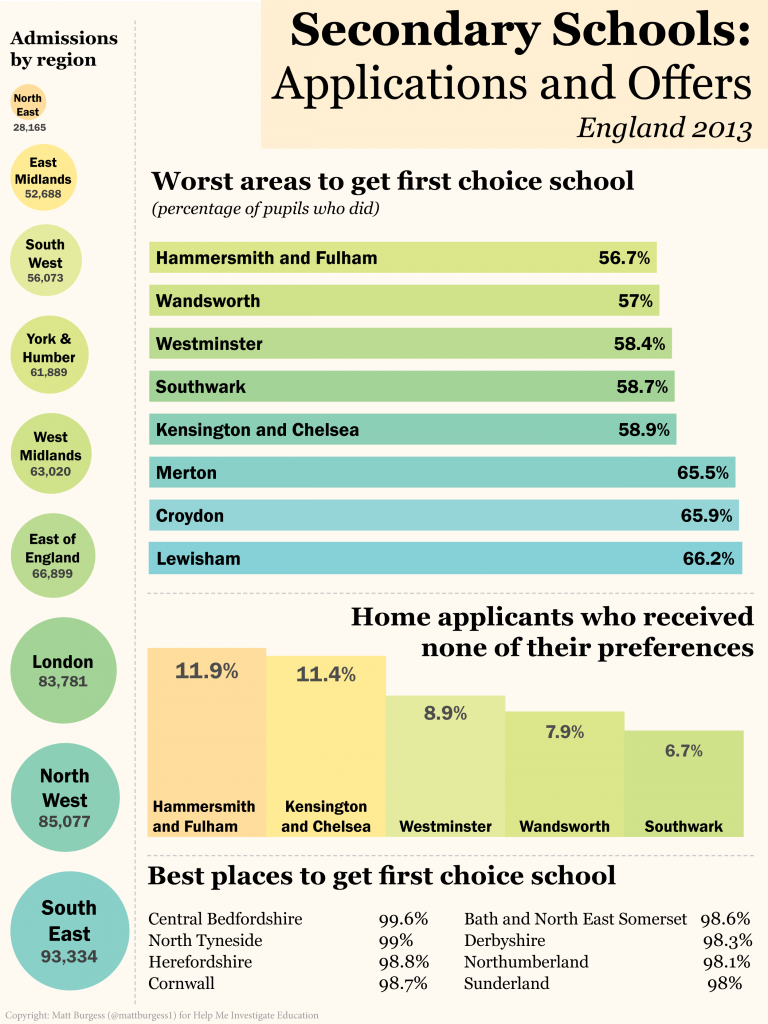
Hammersmith and Fulham, Wandsworth, Westminster, Southwark, and Kensington and Chelsea all had fewer than 60% of pupils getting their first choice schools.
Many of the same authorities also had some of the higher percentages of applicants who received none of their preferences. Hammersmith and Fulham had almost 12% of their applicants not receiving a place at any of their preferred schools. For the area this is approximately 151 pupils.
This is compared to a national figure of 2.4% – 12,090 home applicants – who did not receive places at any of their preferred schools (from a total of 503,734 – down from 512,193 last year).
Although this only represents a small percentage of applicants it can cause great difficulty for families who may have to pay more for their child’s travel to school, while children may also be split from friendship groups.
One third of the pupils not receiving any of their preferences are from London areas, which offer pupils six choices of schools when they apply.
Some areas of the country only offer three choices.
Across London there were 77,322 applications for secondary school positions and 3,866 pupils did not get any of their choices.
We’ve mapped the number of children in each London Borough who did not get any of their chosen schools.
Central Bedfordshire and North Tyneside, came top of the pile for the percentage of pupils getting their first choice schools, as they nearly scored perfect scores with 99.6% and 99% respectively.

Secondary school applications and offers in England: March 2012 by Matthew Burgess
However, it has to be taken into account that 15 authorities across the country are using a fully selective system. Within these grammar schools select pupils by their performance in 11 Plus exams, as well as internal exams and interviews, depending on each school’s preference.
This can skew DfE published figures as those do not take into account how applications for fully selective authorities can change the overall percentages. As a result we have removed these authorities from the graphic above.
For example, the government’s figures show Buckinghamshire and Slough, who are fully selective authorities, as accepting fewer than 55% of pupils with their first choice preferences. A spokesperson for Buckinghamshire told us that 88% of pupils achieve their first choice, once grammar schools have been taken into account.
“If parents want their child to be tested for the 11+ and if qualified, attend a grammar school, they are encouraged to rank grammar schools higher than upper schools. Parents are able to express up to six preferences.”
The full data from the Department of Education can be found here.
If your child/children didn’t get any of their preferred secondary school choices then let us know by emailing: matt@helpmeinvestigate.com
Pingback: Help Me Investigate | Matt Burgess