Tag Archives: computer assisted reporting

Structured Query Language (SQL): an introduction

.
The Centre for Investigative Journalism this year offered a training session on Structured Query Language (SQL) for journalists at the tail end of their summer school, which was well worth attending,

SQL, which runs almost all database programmes, such as Access and FileMaker Pro, is a powerful computer-assisted reporting (CAR) tool that can help you analyse even large datasets by asking questions or “queries” of it, so that you can find the stories worth writing about.

For the purposes of the training, the tutor, David Donald, Data Editor at the Center for Public Integrity (CPI) in Washington D.C., used MySQL and Navicat Lite, both open source. MySQL also runs on all platforms (Windows, Mac or Linux).

I have summarised below some of the basics I have learned, as a taster:

Download and Install

You can download and install MySQL, followed by Navicat, a graphical user interface (GUI – ‘gooey’), from these sites:

Then Install Navicat Lite from here

  1. In Navicat Lite click on Connection > MySQL to create a new connection. 
  2. Give it any name you want, and leave ‘localhost’ as it is (this means your computer). 
  3. Type the password you created for your MySQL databases in the password box. 
  4. Click OK.
(You can also use this window to connect to a server in your company, but you’ll need to ask someone in your technical department for the details.)

Creating your first database
  1. Once you’ve created your connection you’ll notice, there are already a couple of databases – these were added when you installed MySQL. 
  2. Ignore these, but right click either on the name of your connection or the databases and select ‘New Database’.
  3. Give it a name and click OK.
  4. You should now be able to see it alongside the other databases.
 

Importing Tables

  1. Open the Navicat Lite window.
  2. Highlight ‘Tables’ on the left hand column.
  3. The ‘Import Wizard’ will appear at the top. 
  4. Start importing; follow instructions on screen.

When you first import a table for analysis, you will have to tick a few buttons in the Navicat window. Things to remember are the DATA TYPES that you can have for each column:

  • VARCHAR can be text, character or string. If the table uses coding, for example 1 for female, 2 for male, you will want to consider this text, not number, that is, VARCHAR, not FLOAT.
  • FLOAT – if you tick FLOAT, you are telling the computer the data in question is a number
  • DATEs – check if dates on your dataset use the American or British format and select accordingly. Years can be entered as four or two digits, eg 18/07/2011 or 18/07/11.

Basic commands
The following are the six basic commands in MySQL.Conventionally they are written in ALL CAPS.

The two required commands are: 
  • SELECT – tells you which columns or fields you are pulling data from.
  • FROM – the name of the table the data is coming from. May be case sensitive.
All other commands are optional but they MUST be used in this order, even if you don’t use all of them:
  • WHERE – is the criteria and works like a filter [eg =’NHS’ or =#01/05/2010# or >34 / For multiple criteria use AND. eg/ Category=’NHS’ AND Region=’England’]
  • GROUP BY – is the aggregator
  • HAVING – always used together with GROUP BY and is the second criteria after ag gregation
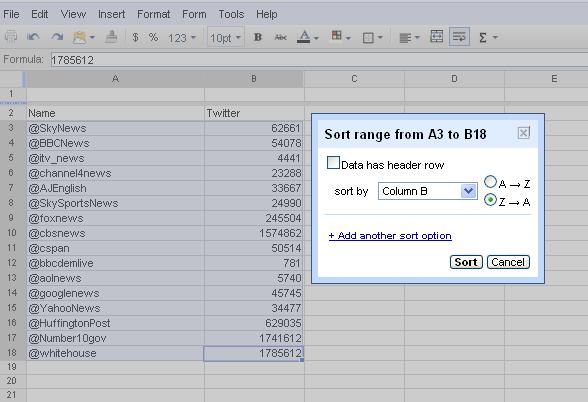
  • ORDER BY – to sort your data; can be numeric or alphabetic

Basic rules for data analysis
  • Never bring in more columns into queries than necessary. Keep them as simple as you can.
  • Queries are extremely literal: any spelling mistakes, spaces where there shouldn’t be one will affect results.
  • To indicate you are expecting TEXT, use single quote mark (‘…’), eg ‘NHS’
  • To indicate you are expecting a NUMBER, use NO PUNCTUATION.
  • To indicate you are expectating a DATE, use hashmarks on both sides (#…#), eg #07/07/77#
  • Use the wildcard (*) to indicate you want the query to consider everything, not specific columns/fields eg in SELECT
  • Never make any changes in the original table. Keep it pristine.

Functions/Expressions and Order by
 If you want to calculate use the function:

SUM(argument) – the ‘argument’ will be a column name, e.g. sum(debt) or sum(amount) [N.B.: no space between sum and the parentheses]

N.B.: You can use a function in SELECT but never in GROUP

You can ORDER BY ascending or descending (DESC) order. The default is ascending. Enter DESC If you want numbers ordered from highest to lowest.

Examples of queries
Say you are working on a table called TENNGIVE, which lists names of people who have made donations to political parties and the sums they donated. A query on MySQL could look like this:

  • SELECT last, rest, sum(amount) [= this means you want query results to show columns called last, rest and the sum of the amounts each person donated]
  • FROM TENNGIVE [=name of table you are using]
  • GROUP BY last, rest
  • HAVING sum(amount) > 2000 [=you only want a list of people who contributed more than 2,000pounds/dollars for example]
  • ORDER BY sum(amount) DESC [=you want the sum column ordered in descending order from high to low]
  • or ORDER BY 3 DESC [=in which 3 indicates you want it to sort column 3]

Observe what happens in this example.
– Last is a column with surnames
– Rest is a column with first names, including middle names
– The list included people called Haslam but I suspect some could be misspelled or they could have Haslam in their middle names
– This was resolved by using LIKE and a % for the possible mis-spellings

  • SELECT last, rest, occupation, sum(amount)
  • FROM TENNGIVE
  • WHERE last LIKE ‘hasl%’ or rest LIKE ‘%hasl%’ [This ensures people with Haslam in their last (last) OR middle names (rest) appear, even if misspelled]
  • GROUP BY last, rest, occupation [Note that GROUP BY does not, and should not, include the function: sum(amount)]
  • ORDER BY 3 DESC

COUNT(*)
Under SELECT you could want a COUNT of how many different occupations are on the table/database, for example 15 lawyers, 10 teachers, etc:
  • SELECT occupation, COUNT(occupation)
  • FROM TENNGIVE
  • GROUP BY occupation
  • ORDER BY 2 DESC

COUNT(occupation) is the ‘argument’ here. But the problem with COUNT is that it does not include any NULLs, which completely skews the results of your query. To resolve this problem use COUNT(*), which counts everything, including nulls.

Many data journalists panic when they realise they have been extracting data without the (*) after COUNT and publishing stories using completely erroneous data. You have been warned: to include the zeros in your dataset, use COUNT(*).

Cleaning data
Your queries could also give you inaccurate results if the data in your table is “dirty”. BBC and B.B.C., Housewife and Housewife(space), for example, could be counted twice when they are the same, or you may want to get rid of any HTML codes in your dataset.

A few ways to clean your data:
  1. Use TRIM in SELECT, eg. SELECT TRIM(occupation), COUNT(occupation)
  2. Use Google Refine, which you can download free onto your computer. The post Cleaning Data using Google Refine in the Online Journalism Blog may help.
  3. Other simple ways of cleaning data on an Excel sheet can be found here.

MySQL servers: MySQL vs. MySQL Server Express
  • MySQL is an open-source relational database system (RDBMS) owned by Oracle, with a freely available code source. It runs on all operating systems (OS). 
  • There is also another free RDBMS called SQL Server Express. The latest version is the 2008 one. Being a Microsoft product, SQL Server Express will only run on Windows but Mac users can download a (free) programme called MAMP (=Macintosh, Apache, MySQL and PHP). 
  • SQL Server is MySQL’s more full-bodied “big brother” but it comes at a cost.
  • Both servers have their pluses and minuses. I found this SQL Authority.com blog post (N.B. bear in mind this post is from 2009) helpful. 

David Donald says with MySQL there are no two ways: it’s “use it or lose it”. The best thing is to download it all and get practising.  

Online Tutorials
Don’t panic – online tutorials and forums are available if you get stuck:
  1. 1. MySQL Tutorial
  2. 2. Tutorials Point (includes a discussion forum)
  3. 3. Navicat support (for Windows, Mac and Linux)

Further reading
  

Further SQL training

SQL is not an exclusive remit of journalists of course. Far from it. Anyone who works or analyses large datasets/databases can benefit from it. As a matter of fact, a few City workers attended the session alongside journalists and CAR enthusiasts like myself.

The session was a crash course, which gave you enough basic knowledge to start using SQL. I assure you it was “safe” even for non-geeks to follow, but, as David said, once you learn it, you do need to keep using it in order to achieve geekdom… 

If you are interested in learning it in more depth, David Donald will be hosting a one-week “CAR bootcamp” in the first week of October. Registration will open after 15th September, so keep checking the CIJ website or sign up to their newsletter.

Updated on 13/09/2011:
Information on the autumn Data Journalism/CAR workshop with David Donald is already up on the CIJ website: 5-9 October 2011. The early bird discount is only valid until Thursday, 15th September, so better hurry. There is also the option of joining the Advanced SQL course on the last three days at a reduced cost. Check out the course’s timetable here and general info here

A brief introduction to Computer Assisted Reporting

Basic CAR Skills

– ‘Computer Assisted Reporting’ is simply about using IT to gather and analyse data in way that allows journalists to produce original news stories.
– As Heather Brooke recently said, increasingly it is through CAR that journalists are finding their exclusives

The first step, according to David Donald, in CAR is learning how to use a spreadsheet. I’m using Google Spreadsheets so you can view these figures yourself (they also offer nice tutorials on how to start using spreadsheets)

Once you’ve got your set of data you’ll have something that looks like this;

*This spreadsheet shows the number of twitter followers of major news organisations in the UK and US – and the White House and Downing Street to add some intrigue .

This data however doesn’t really tell that much of a story – to find the interest we first have to establish a base on which to work from. This is done by ‘sorting’ the data.

To sort – highlight all desired cells, click tools –> sort –> the column you want sorting (in this case it is B as I’m arranging the data by number of followers) –> select high-to-low/low-to-high –> sort, and you’re away.


This then gives this;

… which is a bit more interesting and you (and your audience) are now able to draw conclusions from the data. What this base also does though is direct you towards further lines of investigation.

For instance, this news services featured in this selection are extremely varied so a direct comparison isn’t really fair. One way then to assert who is currently using twitter to best effect may be to see who’s followers figures are increasing the quickest.

(Reporter tip: In most CAR, the really interesting stories lie in the ‘rate of change’ of the figures)

The first set of figures were taken on July 17th, now 12 days later we can see how they have increased.

Using the ‘Formula’ box we can then enter a calculation that will work out the rate of change for each twitter account (as the answer is to go in cell D3, this cell must be selected first). THe equation for this is;

= (new number (C3) – old number (B3) ) / old number (B3)

which gives you;

=(C3-B3)/B3

You can then use the the blue square at the bottom of the D3 square to drag that formula into all other cells beneath – giving you 18 ‘rates of change’ in a very short space of time indeed.

By then highlighting the D column and ‘sorting’ again, you can now see who is proportionately attracting new followers the quickest (highlight the column again and click the % box in the tool bar to put figures into percentages)

Other ways to sort data –

– range =C3:C18 (difference between highest and lowest number)
– median = C3:C18 (the middle value – interesting to compare the average)

Relevant tit-bits of information

– the AP style guide recommends giving numbers to 2 decimal places
– if you are starting with imprecise (often rounded numbers) then don’t use decimal places at all as this will only further distort the data
– audiences enjoy being able to see figures and do their own equations – so use the figures as much as possible and don’t clog up the report with unnecessary narrative (as I probably have with this).
– when requesting data, always ask for it un-aggregated and raw