The Freedom of Information Act is something many of us are now quite familiar with and a method that often throws up pros and cons in gathering less ‘public’ pieces of information. So, if you’ve tried an FOI request and been knocked back for any number of reasons, is there anything else you can use to gather that vital snippet of data that could make front page news?
Well, if you’re interested in accounts or any kind of financial expenditure and you want to investigate local government, then using the Audit Commission Act is another possibility. Richard Orange of Orchard News Bureau Ltd provided a useful insight into the Act and how it can be used at this year’s CIJ Summer School. What is the Audit Commission Act?
The Act permits the inspection and copying of local government accounts for the preceeding financial year. This includes “contracts, bills, vouchers, deeds and receipts.”
In England, Wales and Northern Ireland, accounts must be open for inspection for 20 working days (15 working days in Scotland). These dates must be advertised in a Public Notice in a newspaper circulating in the council/police authority area.
What are your rights under the Act?
As long as you have a home or business address in the borough concerned, you have the right:
– To inspect statements of accounts (by elector)
– To inspect and make copies of all contracts, books, deeds, vouchers, receipts, bills and invoices under audit (‘by persons interested’)
– To object to the accounts (by elector)
How to use the Act
If you want to look at your local council’s accounts, here are a few easy steps to follow:
– Find out the dates the accounts are open to view
– Work out exactly what it is you are interested in before going to view them – the more specific you are the less chance you will experience problems or be swamped with information you do not need
– Once you have worked out what information you are interested in, view the accounts at the earliest opportunity. There is only a 20 day window, so going on day 15 and then realising you need to delve deeper probably means you’ll run out of time before the cut-off
– Make your requests as specific as possible – don’t just ask for all council expenditure, specify the area you want to focus on e.g. PR
– Take any copies of information you need – you may want to revisit it later on when the window to view accounts has closed
Be prepared for ‘excuses’ and challenge them
You may come up against some ‘reasons’ why you cannot do certain things under the Act. Below are some examples you may find, however none are applicable under the law:
– ‘all requests must be put in writing’
– ‘you must make an appointment to view’
– ‘we need to get permission to show you that’
– ‘you are only allowed to see the statement of accounts’
– ‘we need to know why you are asking for the information’
– ‘information about members of staff cannot be viewed’
How do I know when my local council’s accounts are open to view?
The lovely people at Orchard News Bureau have compiled a list of when the major local authorities are open to inspection:
And there’s plenty more here too. And finally
Don’t be put off by any attempts to prevent you from accessing the information you want. Under the law, you have the right to view, copy and object to any accounts kept by your local council (as long as you are an ‘elector’ or ‘persons interested’).
You can uncover some really interesting information using the Act. The key is to know what you’re looking for and request information at the earliest opportunity to allow for subsequent requests should you need them.
A useful presentation (from 2008) by Richard shows some examples of how the Audit Commission Act has been used to hold local council’s to account. |
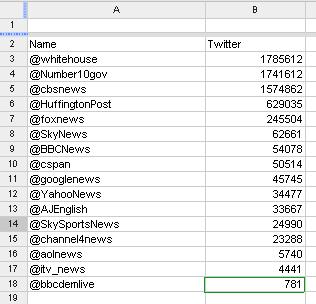 … which is a bit more interesting and you (and your audience) are now able to draw conclusions from the data. What this base also does though is direct you towards further lines of investigation.
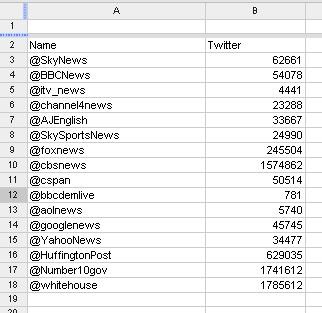
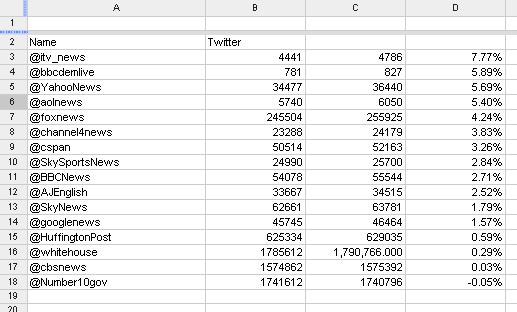
For instance, this news services featured in this selection are extremely varied so a direct comparison isn’t really fair. One way then to assert who is currently using twitter to best effect may be to see who’s followers figures are increasing the quickest.
(Reporter tip: In most CAR, the really interesting stories lie in the ‘rate of change’ of the figures)
The first set of figures were taken on July 17th, now 12 days later we can see how they have increased.
… which is a bit more interesting and you (and your audience) are now able to draw conclusions from the data. What this base also does though is direct you towards further lines of investigation.
For instance, this news services featured in this selection are extremely varied so a direct comparison isn’t really fair. One way then to assert who is currently using twitter to best effect may be to see who’s followers figures are increasing the quickest.
(Reporter tip: In most CAR, the really interesting stories lie in the ‘rate of change’ of the figures)
The first set of figures were taken on July 17th, now 12 days later we can see how they have increased.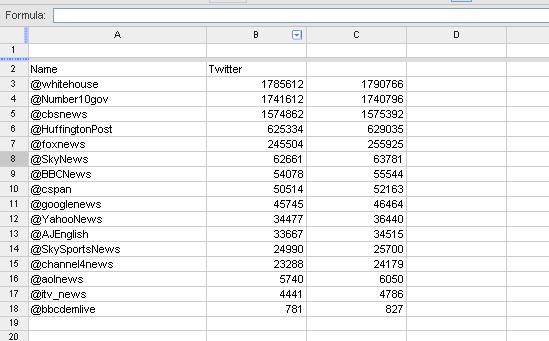
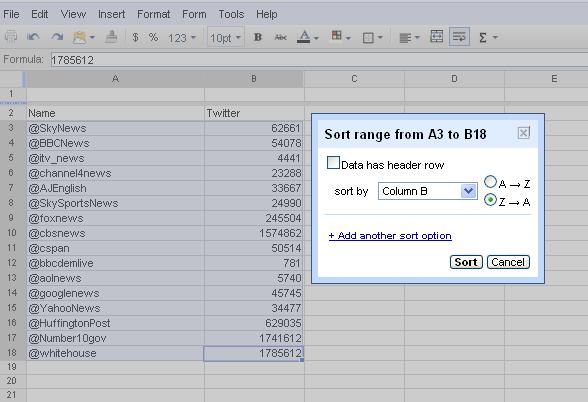
 Other ways to sort data –
– range =C3:C18 (difference between highest and lowest number)
Other ways to sort data –
– range =C3:C18 (difference between highest and lowest number)