From the construction and housing booms to price changes and renting versus buying, Tom Davies presents 4 charts to explain what’s happened to housing.
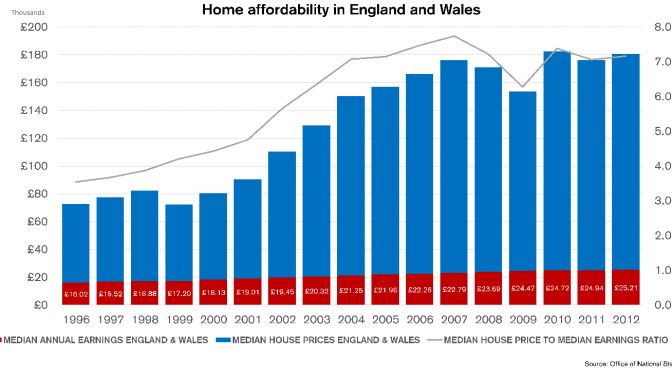
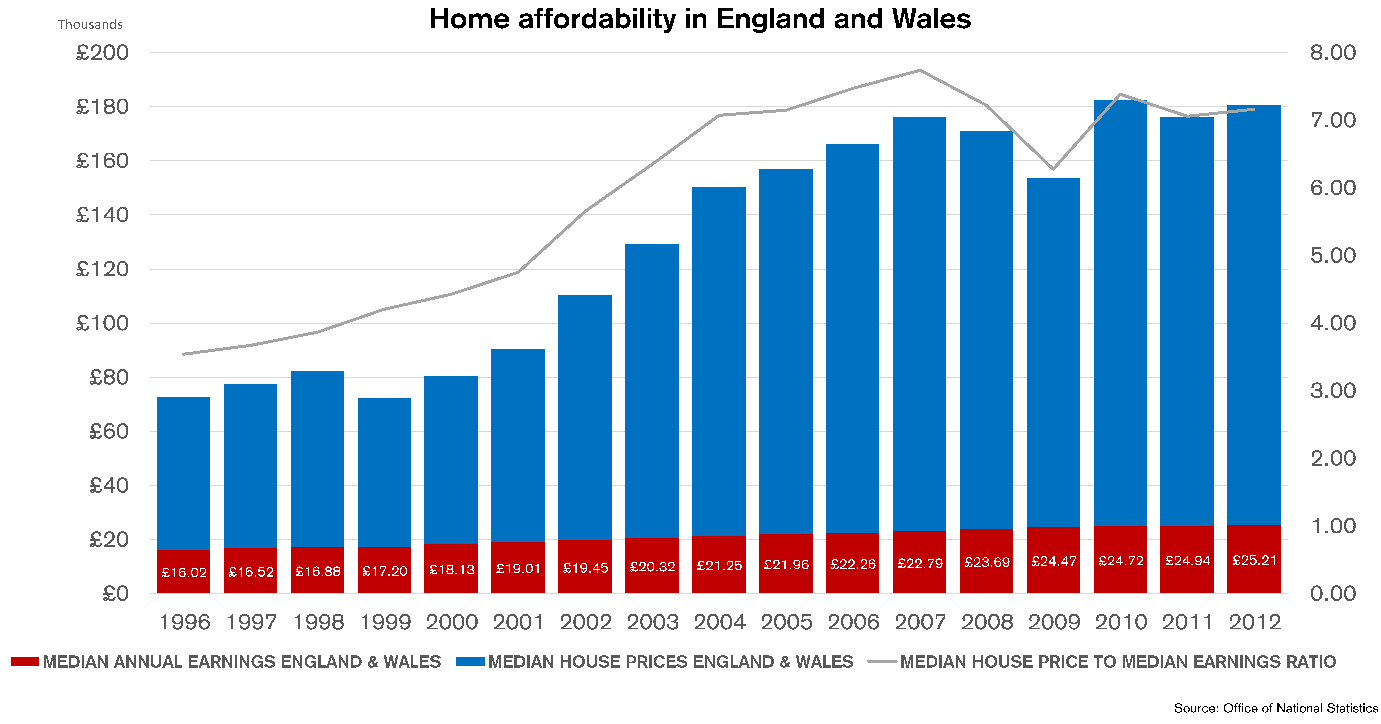
1 Bursting point? Another housing bubble
- How unaffordable can it get? House prices in the UK continue to increase.
Median earnings only increased by 57% from 1996 to 2012, but house prices have gone up by 157%.
Though low interest rates have kept mortgage costs relatively affordable, house prices are now more than twice as expensive relative to earnings.
2 Rent or Buy? The difference when ownership means wealth
- Property matters
In comparison with other European countries, property prices are a significant proportion of the wealth held by British households. In England and Wales, 69% of people own property, whilst this trend is reversed in Germany.

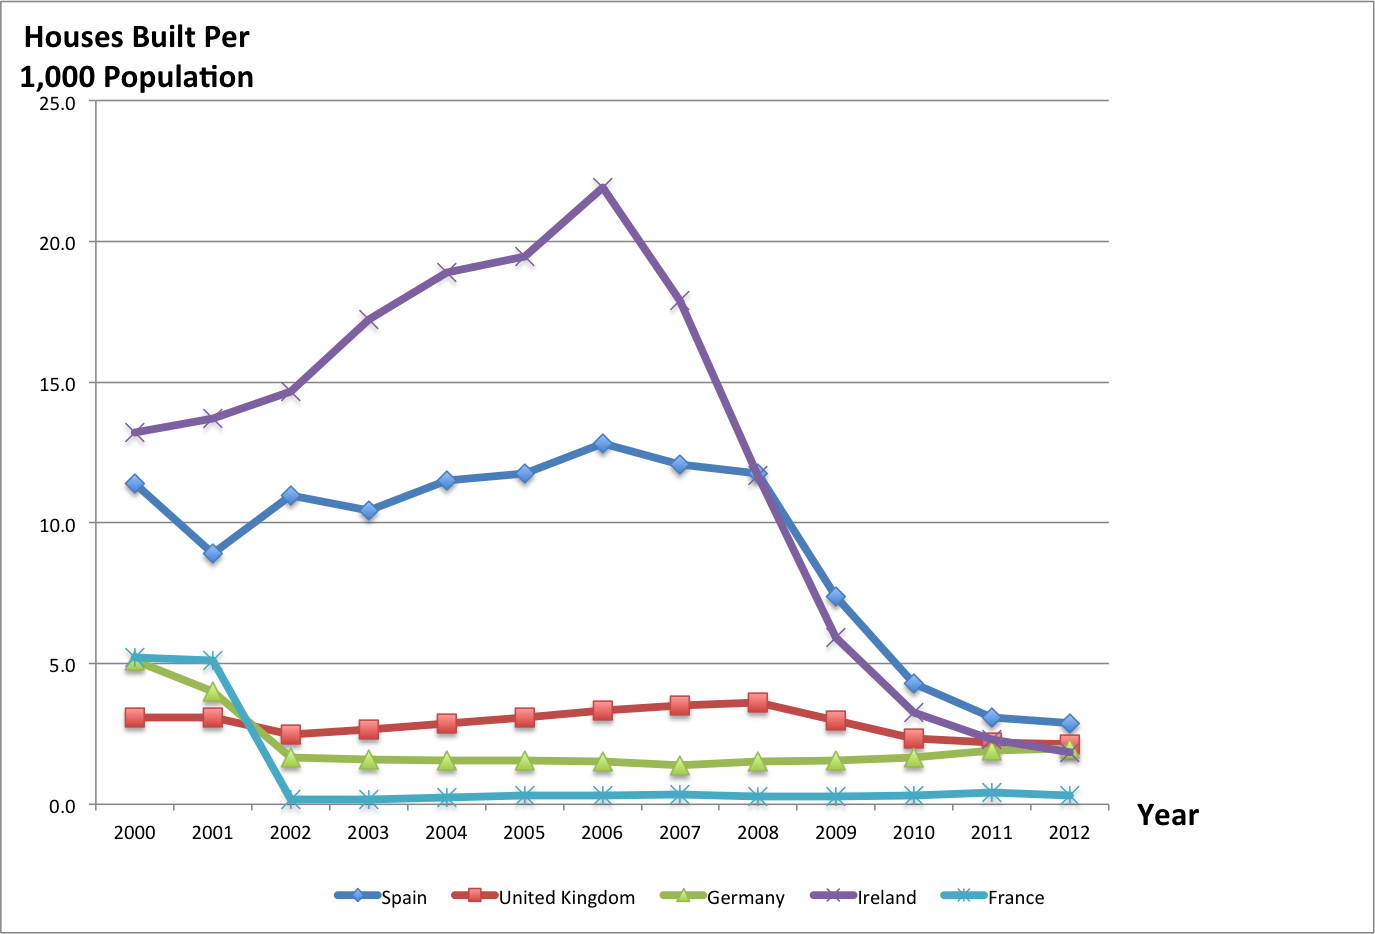
3 Construction Boom
- Houses built per thousand people
Housing supply in the UK has been persistently low. Whilst this has prevented the affordability of property from improving, Ireland and Spain’s construction boom has had disastrous effects on their respective economies.
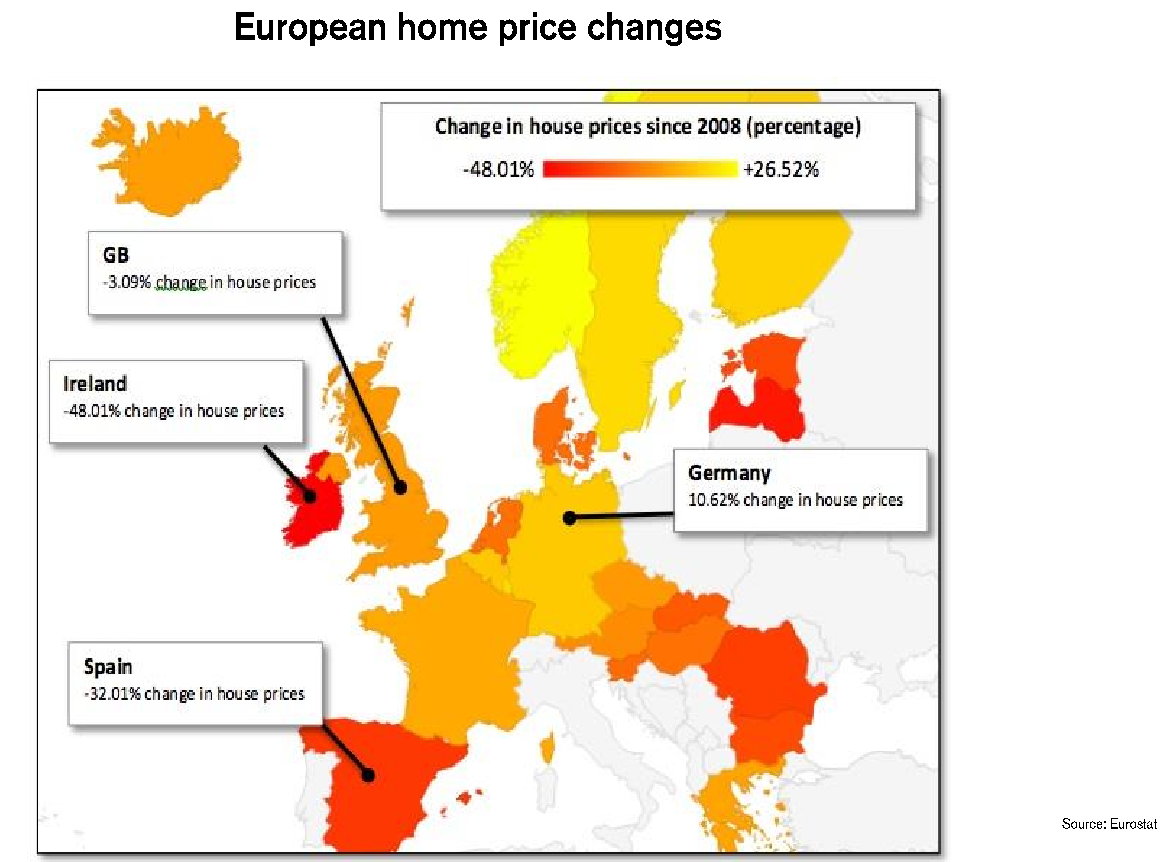
4 Hot Property? The changes in prices since 2008
- The financial crisis only had a temporary effect on UK house prices
The scarcity of housing in the UK has meant that the financial crisis left property prices relatively unaffected. However, if supply continues to be limited, house prices may become unsustainable as the economy recovers and demand picks up.
Let us know if you make any other charts with the data
Get the House Price data