From the construction and housing booms to price changes and renting versus buying, Tom Davies presents 4 charts to explain what’s happened to housing.
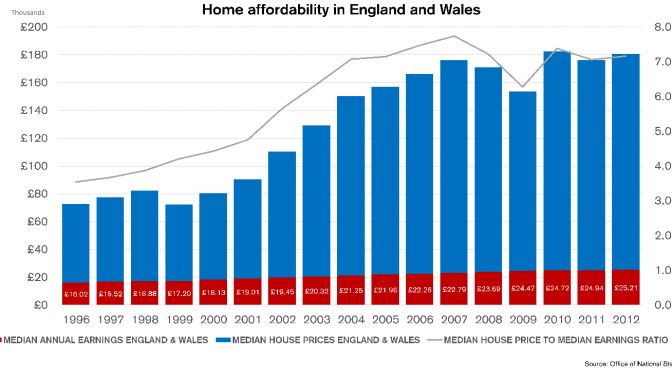
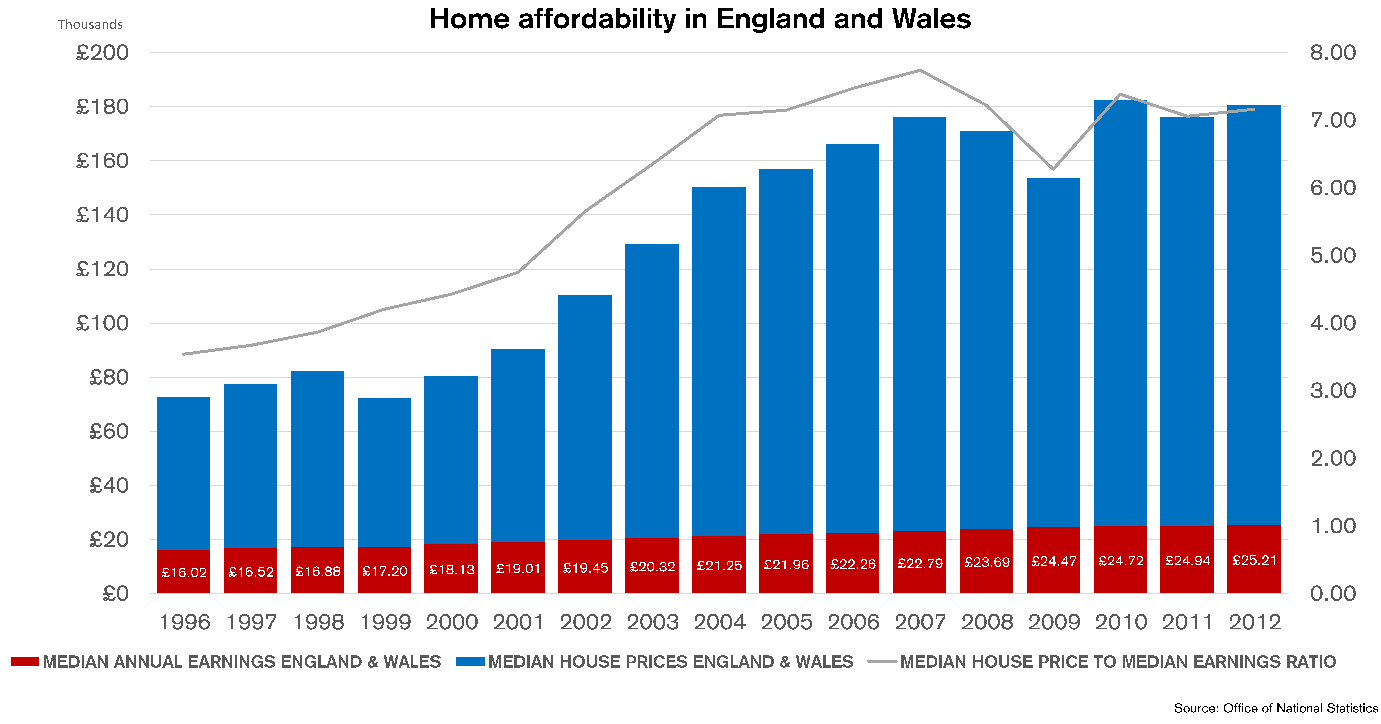
1 Bursting point? Another housing bubble
- How unaffordable can it get? House prices in the UK continue to increase.
Median earnings only increased by 57% from 1996 to 2012, but house prices have gone up by 157%.
Though low interest rates have kept mortgage costs relatively affordable, house prices are now more than twice as expensive relative to earnings.
2 Rent or Buy? The difference when ownership means wealth
- Property matters
In comparison with other European countries, property prices are a significant proportion of the wealth held by British households. In England and Wales, 69% of people own property, whilst this trend is reversed in Germany. Continue reading 4 unmissable graphs of the UK’s housing bubble