Tag Archives: JSA

How unemployment sanctions are driving down the claimant count

Hundreds of thousands of sanction decisions last year have resulted in unemployed people being knocked off the claimant count.

There were almost 320,000 decisions to stop a person’s Jobseeker’s Allowance (JSA) benefit for “not actively seeking employment” in 2013.

And in the first six months of 2014 a further 125,000 sanctions have been applied, according to the latest figures from the Department for Work and Pensions (DWP).

The DWP says the claimant count “includes all cases of claimants who are serving sanctions, provided the claimant continues to keep their claim live during the sanction period.”

However, this is not true for anyone sanctioned for “not actively seeking employment,” as their claims are ended by the DWP.

Dr David Webster, Senior Research Fellow at the University of Glasgow said:

“The most common reason for JSA sanctions is ‘not actively seeking work’, which does not mean what it says but that the claimant has not done exactly what they were told by their Jobcentre adviser, often for reasons beyond their control.”

The claimant commitment

To be considered “actively seeking employment” people must prove they are doing everything in the new claimant commitment.

Claimants have been told to apply for any jobs, including jobs they are not qualified for and would have no chance of getting in order to meet their claimant commitment.

Evidence submitted to the recent Oakley review into sanctions included many examples of people being unfairly sanctioned for this reason.

Examples include:

  • A single mother whose benefits (including her housing benefit) were stopped after it was decided she was “not actively seeking work.” She was under a training programme with a major retailer at the time.
  • An unemployed man in Scotland was sanctioned for “not actively seeking work” while he was at the bedside of his three month old son who was seriously ill in hospital following kidney failure.

Dr Webster said:

“The impact of the massive increase in this type of sanction under the Coalition has been multiplied by the huge increase in the length of penalty.

“Up to October 2012 the penalty was disentitlement, which lasted only until the claimant recomplied, which could be within a few days. Now there is always a 4-week loss of benefit for a first offence, and 13 weeks for a second.”

A version of this article was first published on NatalieLeal.blogspot.co.uk

Benefit sanctions data to be released for first time on DWP stats site

dwp stat_explore

The Department for Work and Pensions statistics site Stat-Xplore will publish data on sanctions  for the first time next month Continue reading Benefit sanctions data to be released for first time on DWP stats site

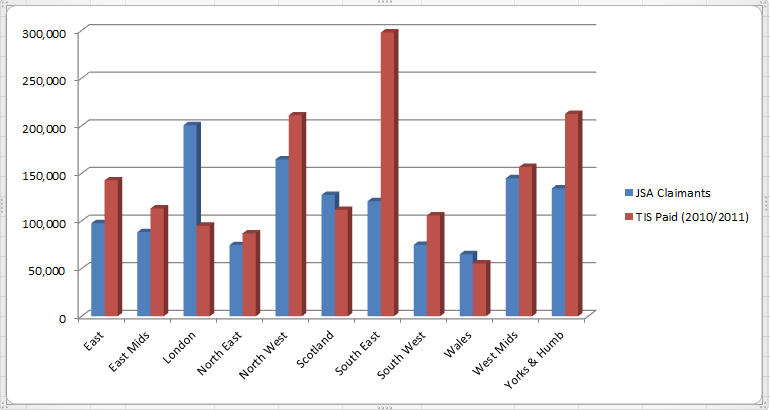
JSA claimants vs.Travel for Interview – the chart

In our previous post, Oliver Conner analysed the number of jobseekers claiming JSA against the amount of Travel for Interview Scheme (TIS) money awarded in 2010/2011.

The JSA claimants’ figures are from 2010 (source: ONS) and the TIS data (source: DWP in a response to an FOI request) covers April 2010 to around August 2011. Of course we are comparing two different types of numbers: amounts of money and total numbers of jobseekers. But if you take the relative national value of those figures, it gives us a good idea of the regional differences.

I have created a chart using Oliver’s figures to facilitate visualisation. Continue reading JSA claimants vs.Travel for Interview – the chart

JSA claimants vs Travel for Interview Scheme: can you map this data?

Joining in our investigation on the demise of the Travel for Interview Scheme (TIS) this week, Oliver Conner researched the number of Jobseeker’s Allowance claimants around the country and compared those figures against the amount of TIS being paid out by region.

His analysis reveals some interesting stats: the South East has been awarded the most amount of TIS by far, whereas the highest numbers of JSA claimants are concentrated in London.

Below is a breakdown of the figures. Oliver obtained this data from the Office for National Statistics (ONS) using a tool called Nomis.

Can you map this data, perhaps comparing it to poverty stats in the country? What is the co-relation between wealth, number of JSA claimants and the amount of money JobCentres spent on Travel for Interview for jobseekers? Anyone up for the challenge? Get in touch.

Region JSA Claimants(Source: ONS Nov 2010) % of total TIS Paid (2010/2011) % of total Discrepancy
East 97,790 7.56% £142,739.00 9.50% -1.94%
East Mids 88,420 6.83% £113,216.00 7.54% -0.70%
London 200,640 15.50% £95,115.00 6.33% 9.17%
North East 74,780 5.78% £87,027.00 5.79% -0.01%
North West 164,720 12.73% £211,048.00 14.05% -1.32%
Scotland 127,440 9.85% £111,827.00 7.44% 2.41%
South East 120,880 9.34% £297,968.00 19.83% -10.49%
South West 75,000 5.80% £105,835.00 7.04% -1.25%
Wales 65,150 5.03% £55,559.00 3.70% 1.34%
West Mids 144,930 11.20% £156,750.00 10.43% 0.77%
Yorks & Humb 134,290 10.38% £212,490.00 14.14% -3.76%
1,294,040 £1,589,574.00