All posts by chieelliott

Disabled group releases report to oppose benefit reforms

A report published today on the controversial welfare reform bill, reveals Parliament may only have been told the partial truth about the overwhelming opposition to the government’s consultation on the planned changes to the Disability Living Allowance (DLA).

Some of the main conclusions of the document, which came to to be known as the “Spartacus report”, are summed up below:

  • Only 7% of organisations that took part in the consultation were fully in support of plans to replace DLA with PIP
  • There was overwhelming opposition in the consultation responses to nearly all of the government’s proposals for DLA reform
  • The government has consistently used inaccurate figures to exaggerate the rise in DLA claimants
  • The report shows that nearly all of the recent increase in working-age claimants of DLA has been associated with mental health conditions and learning difficulties. Between 2002 and 2010, the number of working-age DLA claimants – excluding those with mental health conditions and learning difficulties remained remarkably stable
  • 98% of those who responded opposed plans to change the qualifying period for PIP from three months (as it is with DLA) to six months
  • 90% opposed plans for a new assessment, which disabled people fear will be far too similar to the much-criticised work capability assessment used to test eligibility for employment and support allowance (ESA)
  • Respondents to the consultation repeatedly warned that the government’s plans could breach the Equality Act, the Human Rights Act and the UN Convention on the Rights of Persons with Disabilities

The report, based on data obtained through Freedom of Information requests, was written by Sue Marsh, author of the Diary of the Benefit Scrounger blog. It was researched and funded by thousands of sick and disabled people, who are about to be affected by the cuts to their benefits.

A contributor from the campaign group told Help Me Investigate:

“We have an army of over 600 volunteers to act as ‘constituency reps’. Each has the responsibility to contact their MP in their area with the report, so this will go very widely indeed. We are expecting a lot of press coverage.”

With only two days to go until the House of Lords votes on the bill, the group plans to campaign on Twitter as well and hope to get their hashtag #spartacusreport trending this morning.

Writing on the Guardian’s Comment is Free, Sue Marsh said:

“As evidence of the need for reform, the government has always claimed that DLA figures have risen by 30% in eight years. However, our analysis shows that this too is misleading – in fact the government has admitted that it gives a “distorted view”, yet continues to use the figure when pushing for reform.”
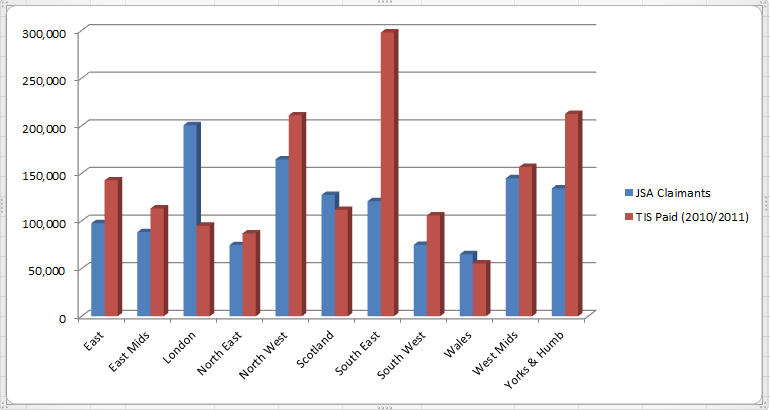


JSA claimants vs.Travel for Interview – the chart

In our previous post, Oliver Conner analysed the number of jobseekers claiming JSA against the amount of Travel for Interview Scheme (TIS) money awarded in 2010/2011.

The JSA claimants’ figures are from 2010 (source: ONS) and the TIS data (source: DWP in a response to an FOI request) covers April 2010 to around August 2011. Of course we are comparing two different types of numbers: amounts of money and total numbers of jobseekers. But if you take the relative national value of those figures, it gives us a good idea of the regional differences.

I have created a chart using Oliver’s figures to facilitate visualisation. Continue reading JSA claimants vs.Travel for Interview – the chart

JSA claimants vs Travel for Interview Scheme: can you map this data?

Joining in our investigation on the demise of the Travel for Interview Scheme (TIS) this week, Oliver Conner researched the number of Jobseeker’s Allowance claimants around the country and compared those figures against the amount of TIS being paid out by region.

His analysis reveals some interesting stats: the South East has been awarded the most amount of TIS by far, whereas the highest numbers of JSA claimants are concentrated in London.

Below is a breakdown of the figures. Oliver obtained this data from the Office for National Statistics (ONS) using a tool called Nomis.

Can you map this data, perhaps comparing it to poverty stats in the country? What is the co-relation between wealth, number of JSA claimants and the amount of money JobCentres spent on Travel for Interview for jobseekers? Anyone up for the challenge? Get in touch.

Region JSA Claimants(Source: ONS Nov 2010) % of total TIS Paid (2010/2011) % of total Discrepancy
East 97,790 7.56% £142,739.00 9.50% -1.94%
East Mids 88,420 6.83% £113,216.00 7.54% -0.70%
London 200,640 15.50% £95,115.00 6.33% 9.17%
North East 74,780 5.78% £87,027.00 5.79% -0.01%
North West 164,720 12.73% £211,048.00 14.05% -1.32%
Scotland 127,440 9.85% £111,827.00 7.44% 2.41%
South East 120,880 9.34% £297,968.00 19.83% -10.49%
South West 75,000 5.80% £105,835.00 7.04% -1.25%
Wales 65,150 5.03% £55,559.00 3.70% 1.34%
West Mids 144,930 11.20% £156,750.00 10.43% 0.77%
Yorks & Humb 134,290 10.38% £212,490.00 14.14% -3.76%
1,294,040 £1,589,574.00

The making of an investigative documentary – Part II

In her previous post, broadcast journalist Kristina Khoo, explained the practical aspects of preparing for and filming a video documentary. In this last instalment, Kristina considers the ethical issues she came across in making an investigative documentary about the homeless in London. Continue reading The making of an investigative documentary – Part II

The making of an investigative documentary – Part I

Kristina Khoo, the journalist behind the investigative documentary on the realities of rough sleepers in London on this site, spent four months gathering information and talking to the homeless and other very vulnerable people in hostels and on the streets. In part one of this post, Kristina shares with HMI Welfare the practical steps involved in making such a documentary, which may help others working on  similar investigations.

Kristina has an MA in International Journalism from Brunel University and is currently available for work. You can contact her on Twitter (@KristinaKhoo) or by leaving a comment here.

Making a an investigative documentary – Part I: Practical steps Continue reading The making of an investigative documentary – Part I

Isle of Wight’s cuts to care services ruled unlawful

A decision to restrict eligibility to community care services on the Isle of Wight has been overturned by a high court judge and considered unlawful – a small victory to the disabled under the council’s care.

The Guardian reports:

“Previously, the council had allocated care assistance to adults assessed to be at critical or substantial risk, the top two levels of a four-tier system. But in February the authority, facing a £33m funding gap after central government cuts, voted to restrict this to those at critical risk. The council argued that the high percentage of retired people on the Isle of Wight made it particularly vulnerable to social care costs.”

The legal action was brought on by the lawyers of two 32-year disabled men, both severely autistic and dependent on the council’s care services.

The council agreed to comply with the ruling and said they would not be appealing the court’s ruling.

The Isle of Wight is not the first local authority whose attempt to cut disability services has been considered unlawful. In May 2011 Birmingham City Council was also found to have failed to comply with the Disability Discrimination Act.

Cuts to disability benefits: how is your local authority coping?

As part of its austerity measures, the British government is making cuts on several welfare benefits. One of the affected groups is Britain’s 10 million disable people (figures provided by the Disabled Living Foundation).

How serious is the situation in your local area?

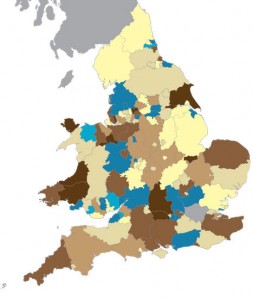
The independent think tank Demos, has mapped out their research data in the area, which allows us to check how well (or badly) each local authority in England and Wales is coping with the budget cuts to disability services. They were ranked as very good, good, well, ok, poor, bad or very bad.

The methodology Demos used to analyse the data and produce a nationwide picture is explained here.

Testimonials compiled on the False Economy site by people affected by the government cuts try to give voice to the current crisis, but more needs to be done.

The Where’s the Benefit campaign put out a call for disabled people in the UK to join their local “Occupy” groups  for a couple of hours every Sunday afternoon and raise awareness on how the welfare reform bill and its proposed cuts are affecting them. WtB also compiled, in a podcast, stories about  the role the Disability Living Allowance (DLA) plays in a disabled person’s life (#myDLA hashtag on Twitter).

In our previous post, Paul Bradshaw wrote about the Department of Work and Pensions’ press release claiming disability benefits were paid “without checks”. The press release triggered several media articles, but published DWP figures were interpreted widely differently on The Daily Mail and The Telegraph. The discrepancy was unpicked on the Left Foot Forward blog.

Have you or a loved one, been affected by cuts to disability benefits? Does the Demos map inspire you to collaborate with an investigation in this area? Would you like to ask Help Me Investigate Welfare to investigate any specific issues/facts/figures? Do you know someone who is already doing that and would like to introduce us to them? Are you good with video cameras and would like to get some live interviews with disabled people joining Occupy on Sundays?

You do not need to be a journalist or researcher in order to help; we will give you guidance and tips. Leave a comment, get in touch.

No rough sleeping by 2012? The reality of homelessness (video)


Less than 300 days left till the opening of the London 2012 Olympic Games. The clock is ticking, but not only for the international sport event. Rough sleeping should also have its days counted – in theory.

In November 2008 the British government launched a £200m strategy to end homelssness in London by 2012, including a more “compassionate” approach towards rough sleepers. Three years on, how close are we to achieving that goal, and is there enough compassion in the way the homeless are being treated?

Kristina Khoo, a journalist with an MA in International Journalism from Brunel University, has produced an investigative documentary (video below) looking into the government’s pledge to eliminate homelessness and the scepticism surrounding it.

Her investigation gives voice to grassroots charities and rough sleepers, who are not normally included into the government’s strategy. The documentary follows the journey of Mohammad, who has been rough sleeping on London buses for the past 10 years, and reveals some of the crude tactics employed to get the homeless off the streets.

According to the latest figures from the Rough Sleeping Statistics England:

  • In autumn 2010, rough sleeping counts and estimates in England was 1,768.
  • London, the South East and the South West had the highest number of rough sleepers with 415, 310 and 270 respectively. The North East had the lowest number with 49.

If you are interested in launching an investigation about housing and homelessness issues too, or if you already have done some work on these topics, do get in touch. We are recruiting collaborators.

Flexible Support Fund: how new is the new Travel for Interview Scheme?

In my last post, I uploaded the response to the DWP to my FOI request about TIS funding.

The letter also confirms that the Travel to Interview Scheme was officially terminated on 4th April 2011 – to be replaced by what is now called the Flexible Support Fund (FSF).

The Citizens Advice Bureau site also explains what new Flexible Support Fund is. (For an enlarged version, click on the image.)

A response to an FOI request requesting clarity about the rules governing the decision making for eligibility to FSF, dated June/July 2011, is available on WhatDoTheyKnow.com, and makes interesting reading.

What we now know is that, although it is up to the JobCentre Plus advisers whether to use the Flexible Support Fund (FSF) to subsidise a jobseeker’s travel to an interview, it is the District Manager who determines how the Flexible Support Fund is spent locally. Guidance notes for JobCentre advisers are also provided for reference.

Flexible Support Fund – the decision making process (FOI)

Flexible Support Fund Adviser Guidance

Are these FSF rules any different from the old Travel for Interview Scheme (TIS)? Or is the FSF just a renaming of TIS, only with less money in the pot?

Any takers to investigate?

TIS investigation kick-off: an FOI request to the DWP

To kick of the investigation about funds allocated to the Travel for Interview (TIS) scheme, I searched the Department of Work and Pensions (DWP) website for any publicly available information.

Some government departments, such as the Department of Health, offer helpful guidance on how to contact them for enquiries, including a customer service telephone number, but searching for information on the Department of Work and Pensions site can be more like a needle-in-a-haystack case.

My search finally led me to the What We Spend page, which published data, in CSV format, on DWP’s payments over £25,000. The data is broken down by month, starting from April 2010, the first month of the 2010/2011 tax year. A PDF of explanatory notes on the monthly payment spreadsheets is also available.

I downloaded some of the spreadsheets to check their content, filtered the data to show only “TIS” (travel for interview) under Expense Type and was delighted to discover that, this way, I could easily obtain the total monthly sums JobCentres spent on TIS.  But I also realised that data alone would not help me draw many useful conclusions as to which parts of the country had the highest number of jobseekers dependent on the scheme to travel to interviews.

Did a breakdown by region exist of TIS funds allocated to JobCentres round the country? In order to create those spreadsheets on their website, the DWP must have originally had more location-specific figures from JobCentres, which had then been collated into the monthly reports.

I used the email address published at the bottom of the list of spreadsheets to ask them the question. The information turned out to be available only under a Freedom of Information request, so I sent it out as one.

Below is the response to my FOI request from the DWP’s communications team:

DWP’s response to FOI re Regional Breakdown of spend on Travel to Interview Scheme 2010/2011

I will now be working on analysing the regional breakdown of TIS funds provided by the DWP, while I research what data maps are available on poverty/deprivation or unemployment rates in the UK. My idea is that we can link those with the TIS figures we now have. Results will be published in a future post, so watch this space.

You are welcome to join the investigation at any stage and contribute in any way you like. Perhaps you are interested in data and knows how to use data visualisation tools? Maybe you’re good with spreadsheets and would like to help clean data. Or you are a skilled web detective and would like to suggest links that could speed up our research?

Please Help Me Investigate. Get in touch.

UPDATE ON OCT. 12, 2011:  I have moved the information on the new Flexible Support Fund (FSF) to a separate post, so that we can investigate it in more detail.