In our previous post, Oliver Conner analysed the number of jobseekers claiming JSA against the amount of Travel for Interview Scheme (TIS) money awarded in 2010/2011.
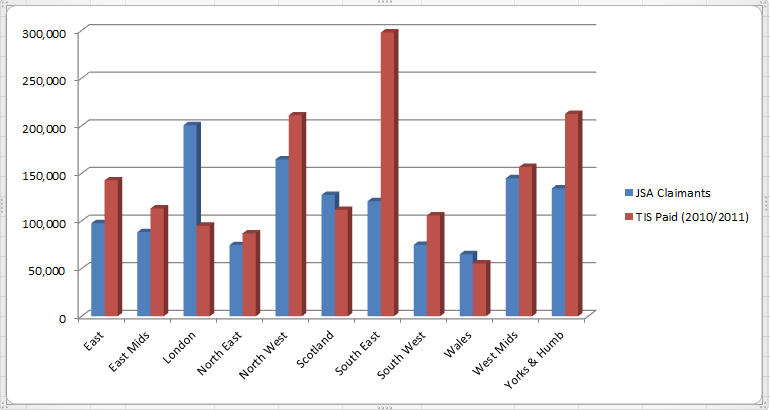
The JSA claimants’ figures are from 2010 (source: ONS) and the TIS data (source: DWP in a response to an FOI request) covers April 2010 to around August 2011. Of course we are comparing two different types of numbers: amounts of money and total numbers of jobseekers. But if you take the relative national value of those figures, it gives us a good idea of the regional differences.
I have created a chart using Oliver’s figures to facilitate visualisation.
If you would like to suggest other sets of data we could use for further analysis, if you are good at data visualisation or data crunching and would like to lend us a hand, we would love to welcome you on board.

One thought on “JSA claimants vs.Travel for Interview – the chart”
Comments are closed.